International tax cooperation: advancing equality and sustainable development
Taxation is critical to financing the SDGs. Fiscal policies can mobilize resources, reduce inequalities, contribute to macroeconomic stabilization, and create incentives for investment and sustainable production and consumption.
Expanding tax capacities is primarily a domestic challenge. However, globalization, financial liberalization, and digitalization have made it easier for businesses and individuals to shift profits and assets to other jurisdictions. No one country can eliminate tax evasion and avoidance on its own. Effective and inclusive international tax cooperation is critical.
International tax rules affect everyone as they shape the global economy and influence all governments’ ability to fund public services. The 2015 Addis Ababa Action Agenda sets principles for international tax cooperation to be universal in approach and scope and to fully consider the different needs and capacities of all countries.
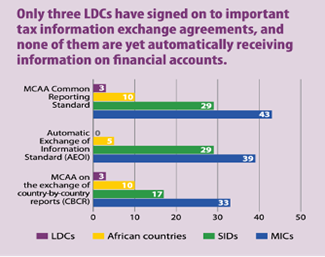
LDCs chart
While there has been an acceleration of international tax cooperation since 2015, existing efforts have been criticized as not responding to the needs, priorities, and capacities of developing countries.
In 2022, the Economic Commission for Africa (ECA) Conference of Finance Ministers made a clarion call for change in the global tax system, calling on UN Member States to begin negotiations for an international convention on tax matters.
In 2023, a groundbreaking initiative followed: the General Assembly decided to establish an ad hoc intergovernmental committee to draft terms of reference (ToRs) for a UN framework convention on international tax cooperation. The goal? Ensuring all countries have an equal voice in setting the international tax agenda, shaping and deciding on rules.
In August 2024, the committee adopted the draft ToRs for the framework convention. These are now with the General Assembly for consideration during its 79th Session.
This initiative represents a shift towards an inclusive, fair, and effective international tax system that addresses inequality and supports global sustainable development.
Expert Voices
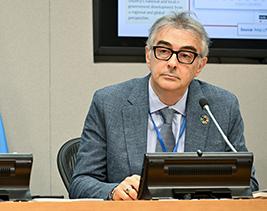
Have you experienced the ease of switching from paper forms to online forms and tracking their progress? E-government offers many such conveniences, ensuring the most vulnerable can access essential services. With the launch of the new E-Government Survey 2024, Vincenzo Aquaro, Chief of Digital Government Branch in UN DESA’s Division for Public Institutions and Digital Government, describes the benefits and challenges of e-government.
How does e-government help us achieve the Sustainable Development Goals (SDGs)?
“The concept of e-government or digital government is no longer new but is becoming progressively more complex with the advent of emerging technologies such as artificial intelligence (AI).
At the same time, the imperative to digitalize institutions and public services has never been more urgent. This is particularly critical given the complex nature of shocks, crises and other challenges, in particular the effects of intersecting and compounding crises related to food, fuel, health and sustainable development.
Digital government plays an important role in accelerating the implementation of the SDGs. By leveraging technology, governments can become more effective, inclusive and accountable, strengthening service provision and accessibility and contributing to the achievement of all 17 SDGs.”
Can you tell us more about the innovations used by the top-ranked countries that make their digital governance effective?
“The top-ranked countries in the UN E-Government Survey 2024 are distinguished by their innovative digital governance frameworks.
Some countries are delivering a wide range of online services and fostering e-participation, while others lead on integrated digital ID systems. We also see nations who are spearheading initiatives, leveraging cutting-edge technologies like AI, data analytics and the Internet of things (IoT) to enhance public services. Countries have also developed open data platforms that promote transparency and provide easy access to government datasets, fostering greater trust in government actions.
We also see significant investments being made in digital infrastructure, e-services and smart technologies, as well as in digital development by moving public data and services to secure cloud platforms, while maintaining uninterrupted internet connectivity via satellite connections. AI-driven platforms are also transforming services such as smart waste management and public safety.”
What can countries who face hurdles in implementing e-government do to leverage its strengths and bridge the digital divide?
“While there is no one-size-fits-all solution, the UN E-Government Survey 2024 highlights key drivers to strengthen capacities and bridge the digital divide. The digital transformation journey is fueled by political will.
At the same time, improving the legislative environment for digital development, particularly on frontier technologies like AI, cloud, open data licensing and digital identity, can benefit all countries.
Regional and international collaborations are essential for driving digital transformation, emphasizing the need for strategic regional and sub-regional frameworks and roadmaps to create an integrated digital economy across nations.
Investment in ICT infrastructure, public-private partnerships and digital public infrastructure programs are expanding broadband networks, ensuring reliable and accessible digital services. E-government platforms are transforming citizen-government interactions, promoting transparency, citizen engagement and service delivery. These efforts are bridging social and economic gaps, fostering inclusive development and poverty reduction across nations.
Data governance is also becoming increasingly important, with regulatory frameworks focusing on data protection and cybersecurity to ensure safe digital platforms and protect citizen data.
Widespread mobile penetration combined with a generation of young people increasingly comfortable with new technologies, offers a unique opportunity for rapid digital adoption, driving e-government services and financial inclusion. Increasing investments in human capital, particularly in STEM education, are equipping the workforce for the demands of the digital economy. Various initiatives are focused on improving digital literacy and providing technical training, ensuring that vulnerable groups, such as women and youth, can fully participate in the digital revolution.
Last but not least, improving e-participation policies and practices is essential for advancing e-government development globally.”
Read the E-Government Survey 2024 here: https://bit.ly/EGovSurvey
UN Photo/Evan Schneider
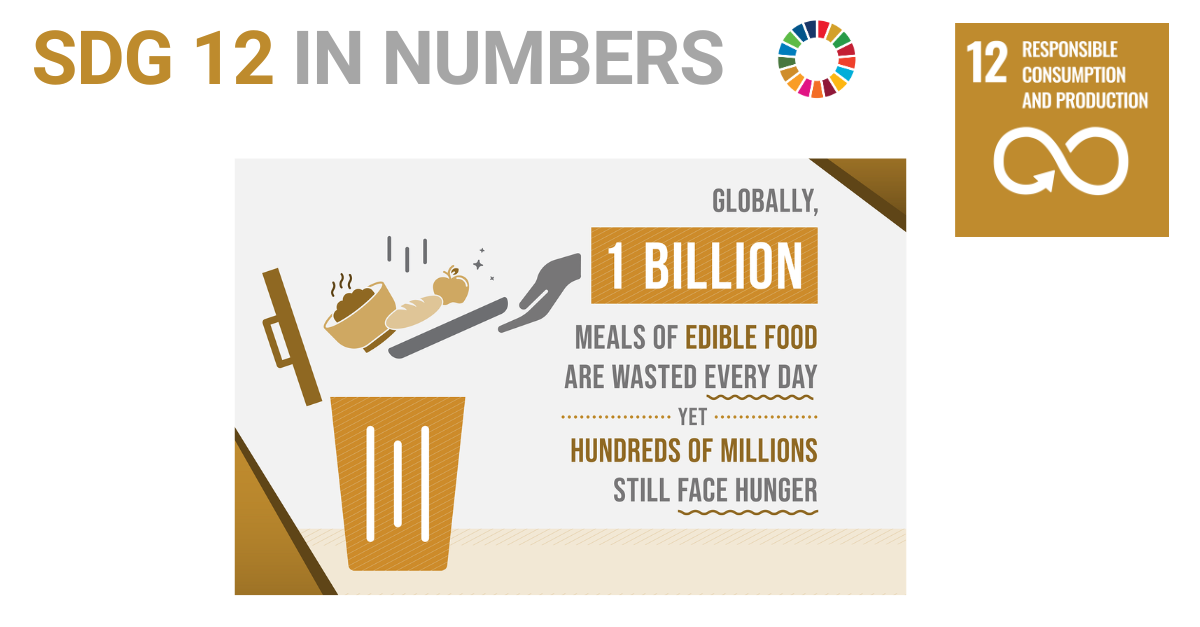
Things you need to know
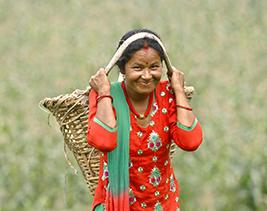
Progress on the Sustainable Development Goals: The Gender Snapshot 2024, the sixth joint publication by UN DESA and UN Women, was launched during the Summit of the Future week. The report reveals that none of the SDG 5 indicators have been met to date, while it examines progress on gender equality across all the 17 SDGs. Here are three things you should know about the latest global progress towards gender equality:
1. There have been some advances towards gender equality globally
Women hold one in every four parliamentary seats, a significant rise from a decade ago. The share of women and girls living in extreme poverty has finally dipped below 10 per cent following steep increases during the COVID-19 pandemic years. Up to 56 legal reforms to address gender disparities have been enacted worldwide since 2019.
2. Progress is far too slow and widespread gender gaps persist across all SDGs
At current rates, gender parity in parliaments remains a distant dream, potentially not achievable until 2063. It will still take a staggering 137 years to lift all women and girls out of poverty. About one in four girls continue to be married as children. Women and girls spend 250 million hours per day on water collection, over three times more than men and boys.
3. Targeted investments can have transformative results, and the world must prioritize six key investment areas
The report outlines investments in food systems, energy, digital connectivity, education, jobs and social protection, and climate resilience to accelerate progress towards gender equality. For example:
Closing gender gaps in agriculture would add $1 trillion to global GDP and lift 45 million people out of food insecurity.
If left unaddressed, the digital gender divide could cost low- and middle-income countries an estimated $500 billion in the next five years.
The annual global cost of countries failing to adequately educate their young populations is over $10 trillion.
For more information see: The SDG Gender Snapshot 2024
Photo: UN Women / Narendra Shrestha

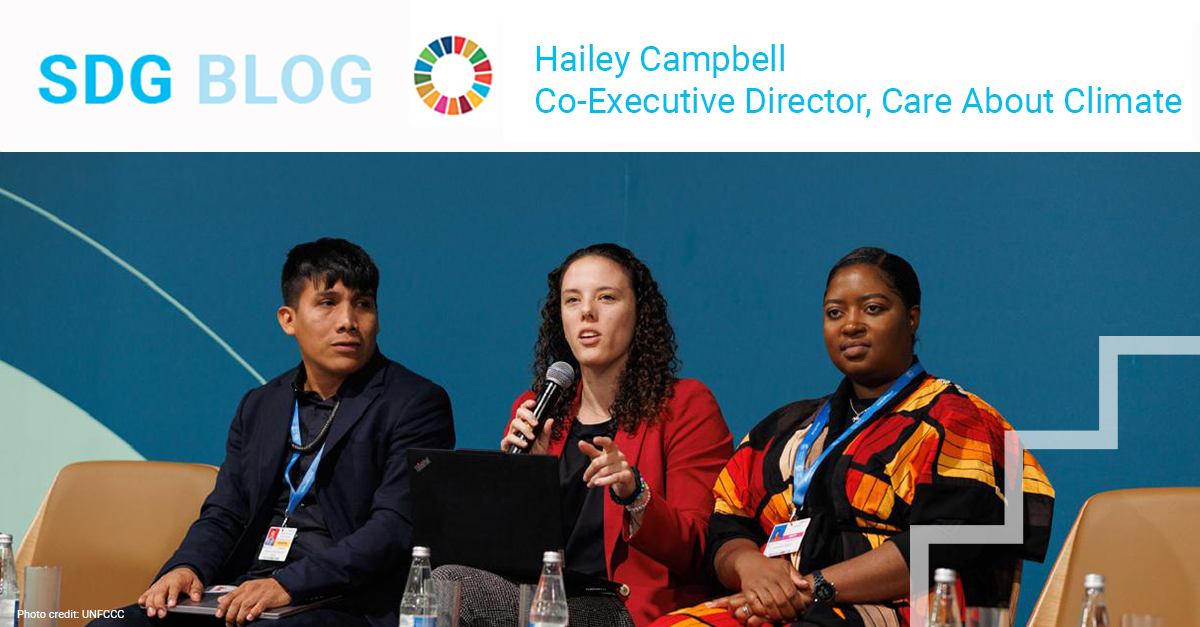
SDG Blog
By UN Women Deputy Executive Director Nyaradzayi Gumbonzvanda
In a global context where less than 30 per cent of parliamentary seats are held by women, 44 per cent of the world’s population live in countries holding presidential and parliamentary elections this year. Only two countries going to the polls in 2024, Mexico and Rwanda, have equal parliamentary representation of women and men. Harmful social norms and gender-based stereotypes perpetuate the idea that the leadership and voices of women are less worthy than those of men.
As of today, our data shows that that not a single indicator of Sustainable Development Goal 5 on gender equality and the empowerment of women and girls has been achieved, and only two out of 18 are close to being met. We are racing against time, with only six years left to close this gap.
Today, close to 120 million girls remain out of school, while the annual education skills deficit is over $10 trillion – more than the GDP of France and Japan combined. Over the next five years, low- and middle-income countries will lose $500 billion in economic activity if they don’t address the gender digital divide.
Without acceleration, a girl born today will be 39 years old before women hold as many seats in parliament as men; 68 years old before child marriage ends; and an extraordinary 137 years old before extreme poverty for women and girls is eradicated.
Last year, 612 million women and girls lived within 50 kilometers of an armed conflict, with a shocking 50 per cent increase in conflict-related sexual violence crimes, mainly perpetrated against women and girls.
Simply put, a future where the full potential of women and girls is not unleashed is a world of missed opportunities.
This year’s Gender Snapshot, prepared by UN Women and the United Nations Department of Economic and Social Affairs, is not just about aggregation of data: it must drive us to connect, discuss and advance solutions and seize opportunities.
We know that with concerted effort, gender equality is achievable. Women’s poverty is declining. Girls have made important strides in education. We see a push for positive legal reforms that promote women’s rights, with huge benefits. For example, countries that have enacted domestic violence legislation have lower rates of intimate partner violence than those without such legislation (9.5 per cent compared to 16.1 per cent).
However, the reality is also that progress is far too slow. Inequalities are increasing, poverty is rife, and the lives of women and girls are being wrecked by violence around the world.
The solutions are tried and tested—invest in women and girls, shift social norms, and the world will thrive, communities will be resilient, and households will prosper.
A package of policies that includes social protection could reduce extreme poverty for 115 million women by 2050. Closing gender gaps in farm productivity and food system wages could raise women farmers’ incomes and increase global GDP by nearly $1 trillion. Investing in the care sector and in infrastructure could create 300 million new decent low-carbon jobs. Having more women in decision-making is the way to move the needle on SDG 5.
We have a clear path ahead. The Beijing Declaration and Platform for Action, adopted in 1995 during the Fourth World Conference on Women, remains the most visionary blueprint for women and girls’ rights. As we approach its 30th anniversary in 2025, we highlight the importance of accountability to the commitments adopted by world leaders three decades ago, which must be recommitted to and resourced.
It is high time to accelerate progress and take bold action around women’s leadership, green economies, ending violence against women, peace and security, and closing the gender digital divide, among others.
Let us remember that gender equality is not just a goal but a fundamental human right and a means to a better future for all. Together, we have the power to create real, lasting change for women and girls.
* The views expressed in this blog are the author’s and do not necessarily reflect the opinion of UN DESA.
Read more here:https://www.un.org/en/desa