MONTHLY NEWSLETTER, VOL. 28 – SEPTEMBER 2024

Shaping our sustainable and prosperous future together
In these uncertain times – characterized by conflicts and geopolitical tensions humanity stands at a crossroads where poverty, hunger, inequality, and the devastating effects of climate change continue to pose challenges. The only viable path to a secure, sustainable and prosperous future in which we all thrive, lies in strengthened collaboration and solidarity among peoples and nations.
Responding to these challenges, the Summit of the Future presents a unique opportunity to revitalize global cooperation, increase solidarity and strengthen commitments to a more peaceful, just and sustainable world. The Summit aims to accelerate the achievement of the 2030 Agenda for Sustainable Development and further facilitate the implementation of the SDGs. Multilateralism emerges as the cornerstone of these collective global efforts, providing the framework for transformative actions needed to make the Sustainable Development Goals (SDGs) a reality for everyone, everywhere. Drawing on the momentum of the 2023.
SDG Summit and the 2024 High-level Political Forum on Sustainable Development, the Summit of the Future aspires to advance this vision.
Advancing a sustainable future, while strengthening the multilateral system
This September, world leaders will gather at the United Nations Headquarters to adopt a Pact for the Future, a Global Digital Compact, and a Declaration on Future Generations as outcomes of the Summit.
The Pact for the Future calls for countries to accelerate sustainable development and financing for development; ensure peace and security; responsibly manage science, technology, innovation and digital cooperation; advance meaningful engagement of youth and future generations; and the transformation of global governance. The Global Digital Compact will serve as a guide to advance a more sustainable and inclusive digital future for all, while the Declaration on Future Generations will lay out the foundation of a world built for those who will inherit it.
Fostering inclusive dialogues
The Summit of the Future, along with the adoption of the Pact for the Future, and its interactive dialogues will take place from 22 to 23 September 2024, at the UN Headquarters in New York.
It will be preceded by two Action Days on 20 and 21 September, which will aim to mobilize governments and stakeholders towards the implementation of the Pact for the Future. The Action Days will kick off with a dedicated, youth-led afternoon followed by sessions focusing on three priority themes – digital and technology, peace and security, and sustainable development and financing.
UN DESA and UNDP are leading the organization of the Session on “A Sustainable Future for All” on 21 September. The session will focus on actions that can help to deliver on the 2030 Agenda and turbocharge progress on the Sustainable Development Goals, including by addressing financing challenges that will be at the core of discussions at the Fourth International Conference on Financing for Development to be held in Spain in June 2025. In addition, a number of side events will be held at UN Headquarters, off-site in New York and virtually.
The Summit of the Future present an opportunity for the international community to bolster multilateral cooperation and solidarity. It aims to prepare countries to address today’s political, economic, environmental, and technological challenges while enhancing foresight on future challenges and seizing tomorrow’s opportunities. It is a call to pursue bold and transformative actions for a shared future that we can only build together.
Photo Credit: Victor Hugo / WMO
Expert Voices
Climate and SDG synergies: the linchpin for an equitable future
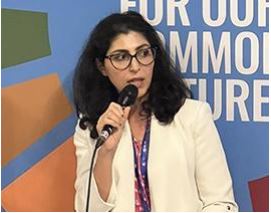
The evidence is clear: climate goals are inextricably tied to the Sustainable Development Goals (SDGs). With so many linkages between the health of our planet and complex challenges like conflict and food security, what can we do to navigate toward progress holistically? Ahead of the Fifth Global Conference on Strengthening Synergies between the Paris Agreement and the 2030 Agenda for Sustainable Development, UN DESA’s Bahareh Seyedi explains.
What opportunities does the conference present for governments to address fragmentation causing insufficient progress on both climate goals and the SDGs?
“The conference takes place at a critical time when it’s abundantly clear that the global community is off-track on both climate goals and the SDGs. The Sustainable Development Goals Report 2024 shows that only 17 per cent of SDG targets are on track. At the same time, global greenhouse gas emissions are at their highest levels in human history. We know from the latest assessment of the Intergovernmental Panel on Climate Change (IPCC) that every fraction of a degree of warming matters. With every additional increment of global warming, changes in extremes, impacts and risks become larger.
The only way to course-correct is to recognize that these crises are interconnected, and tackling them requires integrated and synergistic solutions that address multiple challenges at once. The conference brings together experts from governments and other stakeholders to take a deeper look at what it takes to move away from fragmentation and traditional siloed approaches towards integrated and synergistic solutions that effectively deliver on countries’ climate and development targets.
The dialogues at the conference will be particularly important in the context of the next round of nationally determined contributions (i.e. national climate plans) due in early 2025. Countries are expected to submit new and more ambitious climate plans that are aligned with what scientists say are necessary for limiting global temperature rise to 1.5 degrees and preventing some of the worst effects of climate change. Countries must also put people at the centre of these plans and chart pathways towards a 1.5 degrees future that are equitable and just.“
What are some examples of successful synergistic climate and SDG actions?
“There is a growing number of examples from around the world on synergistic solutions leading to both climate and SDG co-benefits. The latest reports from the Expert Group on Climate and SDG Synergy, which is a group of independent experts, co-convened by UN DESA and UNFCCC, includes a variety of such examples in the areas of policy frameworks, financing systems, cities, knowledge and data.
In many cities, for example, mitigation solutions in land transport, buildings, energy and cooling, and waste management systems have led not only to huge cuts in greenhouse gas emissions, but they have also delivered benefits related to better health and air quality (SDG 3), improved food security (SDG 2), more efficient use of water (SDG 6) and energy (SDG 7), as well as reducing inequalities (SDG 10). The conference will shed light on more examples as different stakeholders are invited to share lessons learned and best practices on synergistic solutions across their areas of expertise.”
How can we ensure that everyone benefits from the proposed solutions, and not just some people?
“While there is increasing attention to equity, inclusiveness and just transition in intergovernmental fora related to climate change and development, many countries continue to grapple with socio-economic tensions arising from distributional impacts of climate policies.
To ensure synergistic solutions are inclusive and benefit all groups in society, it is critical to take into account the contextualized nature of these solutions and navigate potential trade-offs. Who benefits, who loses and who pays must be key considerations. Distributional effects, including impacts on people living in poverty and other people in vulnerable situations, which may vary in different contexts, must be taken into account. The topic of just transition and inclusive approaches that leave no one behind will be one of the main themes of the conference. “
For more information:
Climate and SDG Synergy Fifth Global Conference
Things you need to know
4 things to know about the latest global population trends
The global demographic landscape has evolved greatly, driven in large part by
rapid fertility declines in some of the world’s most populous countries.
Understanding how population trends are unfolding is critical for achieving a
more inclusive, prosperous and sustainable future. Here are four things you should know about the latest global population trends:
1. One in four people today live in a country whose population has already peaked in size
In 63 countries and areas, the size of the population peaked before 2024. For countries such as Italy, Germany and the Russian Federation, the population size would have peaked even sooner in the absence of immigration. For most countries and areas with populations that have already peaked, low levels of fertility are the major driver of the ongoing population decline.
2. Following the COVID-19 pandemic, global life expectancy is rising once again
Global life expectancy at birth reached 73.3 years in 2024, having fallen from 72.6 in 2019 to 70.9 at the peak of the pandemic in 2020 and 2021. In 2023, the number of deaths among children under age 5 fell below 5 million for the first time in recent history.
Despite such success, much remains to be done: 95 per cent of these child deaths
occurred in countries and areas where the population is expected to still be growing at mid-century, including the Democratic Republic of the Congo, India, Nigeria and Pakistan.
3. Women today bear one child fewer, on average, than they did around 1990
In more than half of the 235 countries and areas that comprise the global population, women are giving birth to fewer than 2.1 children over a lifetime, below the level required for a population to maintain a constant size in the absence of migration. In 2024, it is projected that 4.7 million babies will be born to mothers under age 18 worldwide. Investing in the education of young people, especially girls, and raising the average ages of marriage and of first childbearing are critical for improving women’s health and increasing their labour force participation in locations where early childbearing is still common.
4. Population ageing is an inevitable outcome of the demographic transition
The decline of fertility and the increase in life expectancy have contributed to a shift in the population age distribution towards older ages. In countries and areas with relatively low levels of fertility and high levels of life expectancy, such as Canada, France and Sweden, more than 20 per cent of the population is already aged 65 years or older in 2024. Understanding and measuring population ageing is crucial for planning and taking action to effectively address its consequences.
For more information: World Population Prospects 2024
Photo Credit: World Bank / Sarah Farhat
 It’s time we embrace politics to achieve the Sustainable Development Goals
By Minh-Thu Pham, Co-founder and CEO, Project Starling
Despite being an inherently political institution, the United Nations is not a place where we like to talk about politics – at least explicitly. And yet politics – which determines how our societies are governed, what the rules are, who determines them, and how we manage relations – plays a major role in whether we solve problems together and achieve the aims laid out in ambitious UN agreements. Those of us focused on achieving the Sustainable Development Goals or addressing climate change, or any number of global challenges must reexamine the state of our politics and figure out how to harness it to deliver results
for people.
In a world where crises no longer confine themselves to borders, the interconnected nature of our challenges demands a level of global cooperation that should be unprecedented. But trust in political leadership and in our institutions is eroding. In recent months, widespread discontent has led to historic political shifts worldwide, signaling tremendous demand for change. Leaders have inadequately addressed the public’s demands for meaningful action. The question is, will we respond to and channel that discontent in a way that regains public confidence and deliver transformative change – or will we succumb to the temptation to play it safe, stick to what we know, and avoid taking risks to do things differently? I think we must embrace risk and develop better ways to problem-solve together.
Our collective failure to act has destabilized domestic politics and eroded the foundations of global governance. As a result, our current politics have led to the decline of long established institutions and the rise of populist movements that offer simplistic, regressive solutions to complex global challenges.
In 2024, about half the world held national elections, and so far, these elections have been marked by a widespread dissatisfaction with the status quo as voters react to economic inequality, the rising cost of living, and the perception that leaders are out of touch with the realities faced by ordinary people. Economic strains have made the perceived costs of the green transition less politically palatable and driven a turn back towards unsustainable energy sources. These trends have fueled a sense that global cooperation and solidarity with people in other parts of the world will make us worse off – a fear that many politicians have used to their advantage.
Countries across the world are dealing with rising global debt, as politicians propose to cut taxes or increase government spending to gain electoral support. And geopolitical tensions and security concerns are incentivizing governments to spend more on defense and, thus, less on social programs or sustainable development.
But the real danger to global stability lies not only in the loss of power by incumbents but also in how we interpret their losses. Did politicians lose support because their constituents want them to turn inward, focus on narrow national interests, and withdraw from the world? Or did they lose support because of their failure to adequately address transnational problems that have made people worse off? What if we responded differently this time? Perhaps the time will soon come when deciding to invest in global cooperation and choosing global solidarity can win elections.
At these crossroads, the UN Summit of the Future taking place among heads of state and government at the UN this September will provide a blueprint for renewing global governance – how we work together, on what issues, and who gets to help determine the rules – which are, essentially, political questions. Importantly, it will help determine whether we move towards a more equitable and collaborative global order or retreat into narrow, nationalistic agendas that
further fracture our shared future. In sum, this Summit is important for achieving the SDGs. History has shown that moments of crisis can turn into occasions of opportunity. The last significant wave of global governance reform was born out of the devastation of global conflict, when political moods had shifted and people viewed humanity more expansively. After immense division, they were ready to collaborate.
Today, we may be on the brink of another such moment. The urgency of the moment demands us to think of politics not as divisive and cynical but as a way to bring in, unite, and inspire hope — to allow more actors to engage, to elevate the voices of the vulnerable, and to shift power and share it with those bearing the brunt of global crises.
That’s what “Leaving No One Behind” has to mean as 2030 approaches. We can’t achieve the SDGs without taking into account the desire of the public for a different kind of politics. Instead, we must respond to public discontent by changing how we make decisions and who we give power to and include in decision-making – by confronting politics head on and embracing the positive impact it can deliver. The time for unprecedented action is now.
* The views expressed in this blog are the author’s and do not necessarily reflect the opinion of UN DESA.
More from UNDESA
Now is the time for action to advance sustainable energy for all
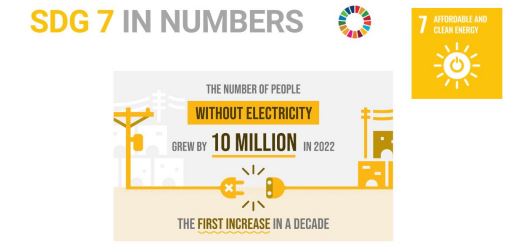
With only six years left to achieve the Sustainable Development Goals (SDGs), the promise of the 2030 Agenda for Sustainable Development is in peril. The fragility of past hard-earned progress has been exposed by the climate crisis, spreading conflict, and a constrained global economic outlook.
As these global crises have also impacted energy issues, progress on SDG7 – ensuring access to affordable, reliable, sustainable, and modern energy for all – has slowed. But SDG7 can and must still be achieved. Energy is an essential ingredient for getting the world on track towards meeting the SDGs and the objectives of the Paris Agreement on climate change.
The ENERGYNOW SDG7 Action Forum 2024 will support these efforts by providing a platform to connect all stakeholder groups, including decision makers and practitioners, in support of driving momentum and mobilizing action. The Forum will showcase Energy Compacts, present success stories and best practices, and strengthen multistakeholder dialogue in support of accelerated SDG7 action. It will explore concrete ways to accelerate just, inclusive, and equitable energy transition towards net zero, building on the outcomes of COP28.
The Forum will take place on 25-27 September 2024 on the margins of the United Nations General Assembly High-level Week 2024. At the General Debate, the Summit of the Future and other high-level meetings and events, Heads of State and Government and other world leaders will gather to explore solutions to the intertwined global challenges to advance peace, security, and sustainable development.
This annual event is convened by UN-Energy, the interagency coordination mechanism on energy within the UN system, where UN DESA serves as the Secretariat.
For more information: ENERGYNOW SDG7 Action Forum 2024
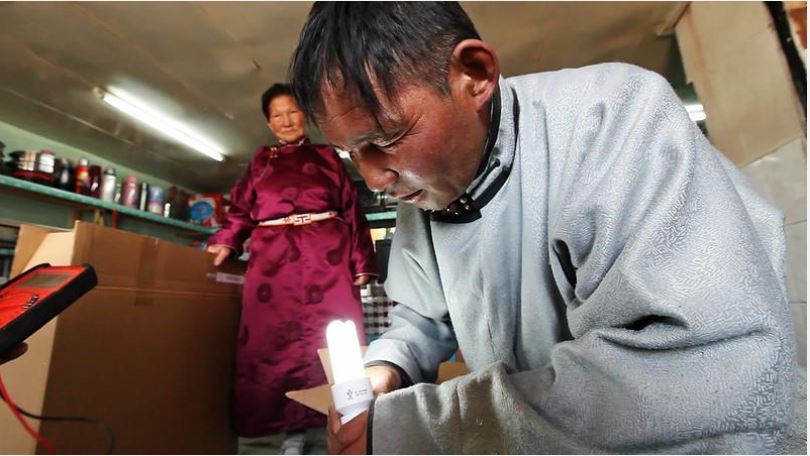
Photo Credit: Video still: Stephan Bachenheimer / World Bank
 https://www.un.org/en/calendar-by-property/month/81254/2024-09
Read more here: https://desapublications.un.org/un-desa-voice/september-2024


.jpg?width=520&upscale=true&name=PARAG%20PHOTOS%20AGE%200-13_00003A%20(1).jpg)

.jpg?width=1120&upscale=true&name=composite-map-scaled%20(2).jpg)